- Discovered explicit decision boundary formula with 100% classification accuracy
- Formula:
ceil(-1 * tanh(round(x * y - cos(-2 * (y - x))))) - Unlike SVM/AdaBoost, the boundary is an interpretable equation
- Extends to any number of dimensions—not limited to 2D visualization
TuringBot vs. Traditional Classifiers
| Aspect | TuringBot Formula | SVM / AdaBoost / Neural Net |
|---|---|---|
| Decision boundary | Explicit equation | Implicit (hyperplanes/weights) |
| Visualization | Plot the formula directly | Grid sampling required |
| Deployment | Single equation | Requires sklearn/framework |
| Insight | See which features matter | Feature importance analysis needed |
The Problem
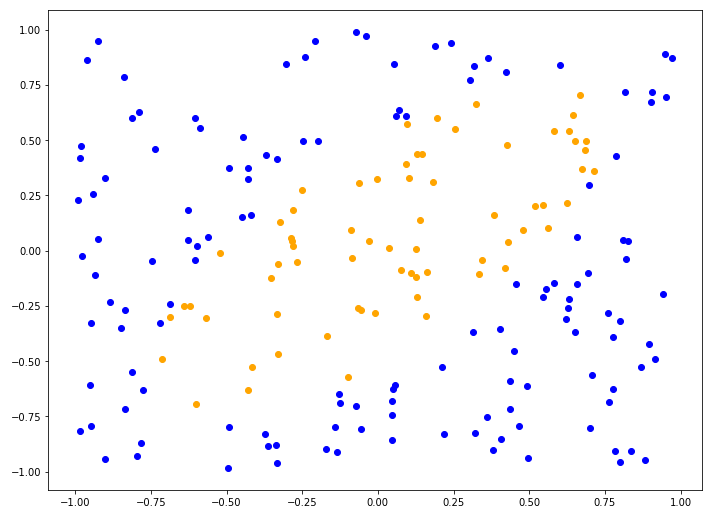
Find a mathematical function f(x, y) that returns 0 for one category and 1 for another. Traditional methods like SVM and AdaBoost can solve this but output black boxes—see scikit-learn's classifier comparison for examples.
Symbolic regression
The way to solve this problem with symbolic regression is to look for a formula that returns 0 for points of one category and 1 for points of another. In other words, a formula for classification = f(x, y).
We can look for that formula by generating a CSV file with our points and loading it into TuringBot. Then we can run the optimization with classification accuracy as the search metric.
If we do that, the program ends up finding a simple formula with an accuracy of 100%:
classification = ceil(-1 * tanh(round(x * y - cos(-2 * (y - x)))))
To visualize the decision boundary associated with this formula, we can generate some random points and keep track of the ones classified as orange. Then we can find the alpha shape that encompasses those points, which will be the decision boundary:
from math import *

import matplotlib.pyplot as plt
import numpy as np
from scipy.spatial import ConvexHull

def f(x, y):
    return ceil(-1 * tanh(round(x * y - cos(-2 * (y - x)))))

# Generate points
pts = []
for _ in range(10000):
    x = np.random.random() * 2 - 1
    y = np.random.random() * 2 - 1
    if f(x, y) == 1:
        pts.append([x, y])

pts = np.array(pts)

# Compute the convex hull
hull = ConvexHull(pts)
hull_pts = pts[hull.vertices]

# Plotting
fig, ax = plt.subplots()
ax.plot(pts[:, 0], pts[:, 1], 'o')
for simplex in hull.simplices:
    ax.plot(pts[simplex, 0], pts[simplex, 1], 'k-')

ax.set_xlim(-1, 1)
ax.set_ylim(-1, 1)
plt.show()
And this is the result:
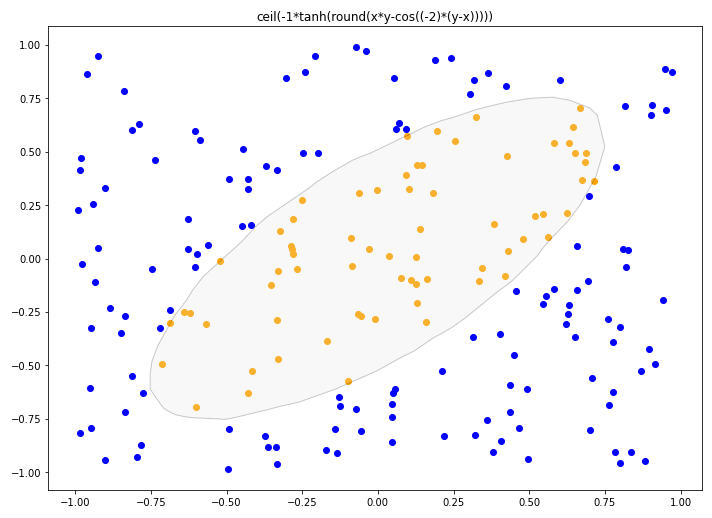
It is worth noting that even though this was a 2D problem, the same procedure could have been carried out for a classification problem in any number of dimensions.