To find an equation from a list of values, a special technique called symbolic regression must be used. The idea is to search over the space of all possible mathematical formulas for the ones with the greatest accuracy while trying to keep those formulas as simple as possible.
In this tutorial, we are going to show how to find formulas using the desktop symbolic regression software TuringBot, which is very easy to use.
How symbolic regression works
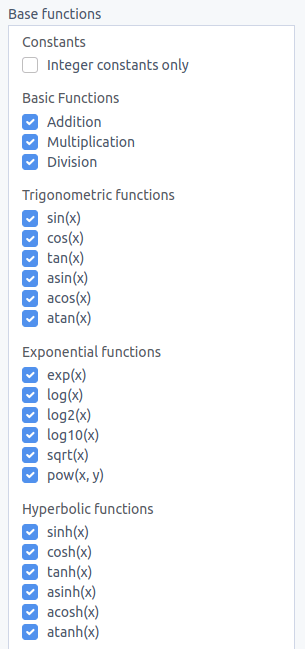
Symbolic regression starts from a set of base functions to be used in the search, such as addition, multiplication, sin(x), exp(x), etc and then tries to combine those functions in all possible ways to find a model that will be as accurate as possible in predicting a target variable. Some examples of base functions used by TuringBot are the following:
As important as the accuracy of a formula is its simplicity. A huge formula can predict with perfect accuracy the data points, but if the number of free parameters in the model is the same as the number of points then this model is not informative. For this reason, a symbolic regression optimization will discard a larger formula if it finds a smaller one that performs just as well.
Why symbolic regression instead of curve fitting?
| Aspect | Symbolic Regression (TuringBot) | Polynomial / Spline Fitting |
|---|---|---|
| Functional form | Discovered automatically | Must be specified in advance |
| Multi-dimensional data | Any number of input variables | Usually limited to 1-2 variables |
| Interpretability | Compact, meaningful formulas | Often high-degree polynomials |
| Extrapolation | Better (discovers underlying form) | Poor outside training range |
Finding a formula with TuringBot
Finding equations from data points with TuringBot is a simple process. The first step is selecting the input file with the data through the interface. This input file should be in TXT or CSV format. After it has been loaded, the target variable can be selected (by default it will be the last column in the file), and the search can be started. This is what the interface looks like:
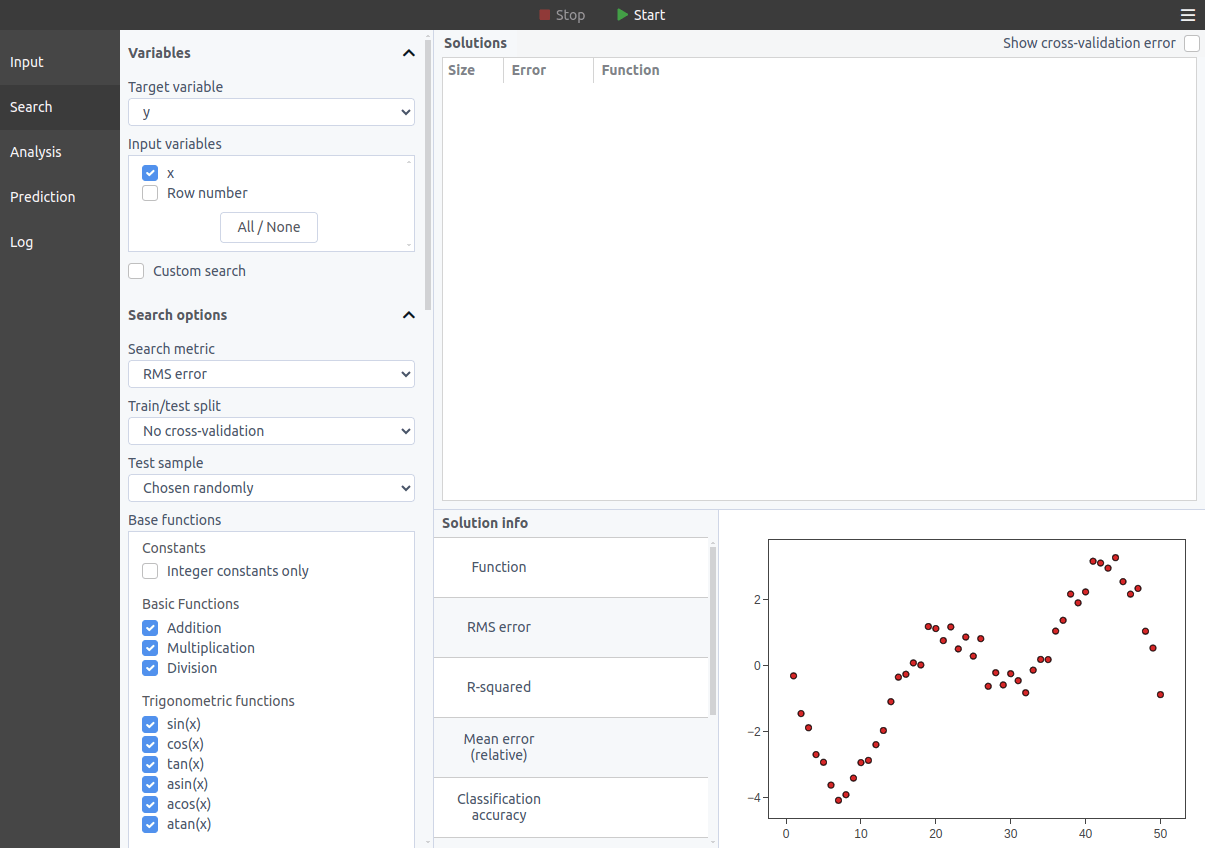
Several options are available on the menus on the left, such as setting a test/train split to be able to detect overfit solutions, selecting which base functions should be used, and selecting the search metric, which by default is the root-mean-square error, but that can also be set to classification accuracy, mean relative error and others. For this example, we are going to keep it simple and use the defaults.
The optimization is started by clicking on the play button at the top of the interface. The best formulas found so far will be shown in the solutions box, ordered by complexity:
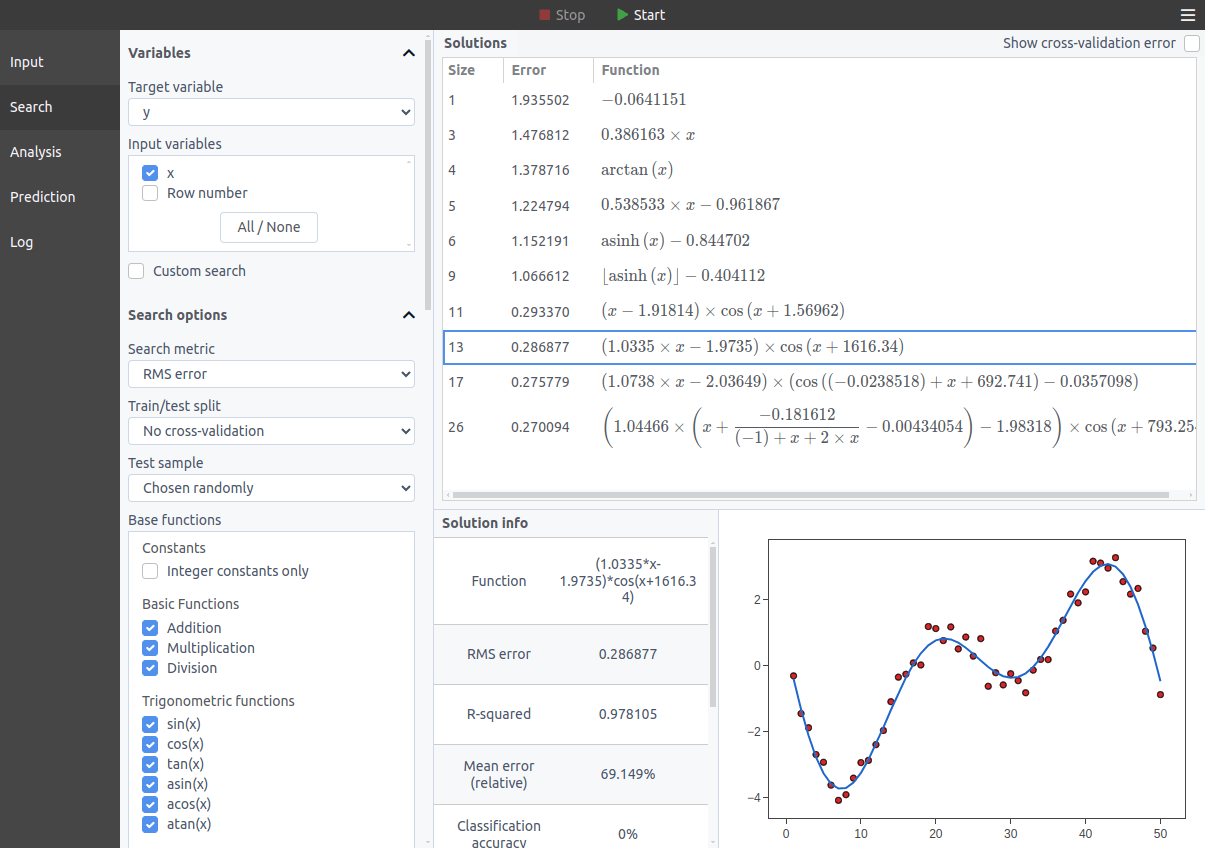
The software allows the solutions to be exported to common programming languages from the menu, and also to be exported as text. Here are the formulas in the example above exported in text format:
Size   Error       Function
1      1.9355      -0.06411509468606831
3      1.47681     0.3861641791441454*x
4      1.37872     atan(x)
5      1.22479     0.5385325107323634*x-0.9618674151587699
6      1.15219     asinh(x)-0.8447018744527393
9      1.06661     floor(asinh(x))-0.4041123079245318
11     0.29337     (x-1.918139596060958)*cos(x+1.569621219317148)
13     0.286877    (1.033502006421235*x-1.973497683780924)*cos(x+1616.342933791382)
17     0.275771    (1.073799148789318*x-2.036485176476265)*(cos((-0.02586499591744462)+x+692.7407082616979)-0.03570979350850057)
26     0.26977     (1.044661019632973*(x+(-0.1816120034881618)/((-1.001208764)+x+2*x)-0.009403549172188269)-1.961269371426368)*cos(x+793.2540407188337)
Conclusion
In this tutorial, we have seen how symbolic regression can be used to find formulas from values. Symbolic regression is very different from regular curve-fitting methods since no assumption is made about what the shape of the formulas should be. This allows patterns to be found in datasets with an arbitrary number of dimensions, making symbolic regression a general-purpose machine learning technique.