Say you have a company or want to invest in a company, and you want to predict how much it will grow in the coming months or years. How to do that?
Here we will show how this problem can be modeled in a very simple way using symbolic regression.
Preparing the data
Our goal will be to find an explicit mathematical formula that predicts some desired quantity of a company as a function of time.
The dataset that we are going to use consists of the number of Google clicks to one of our client’s website as a function of the day index, starting from 1:
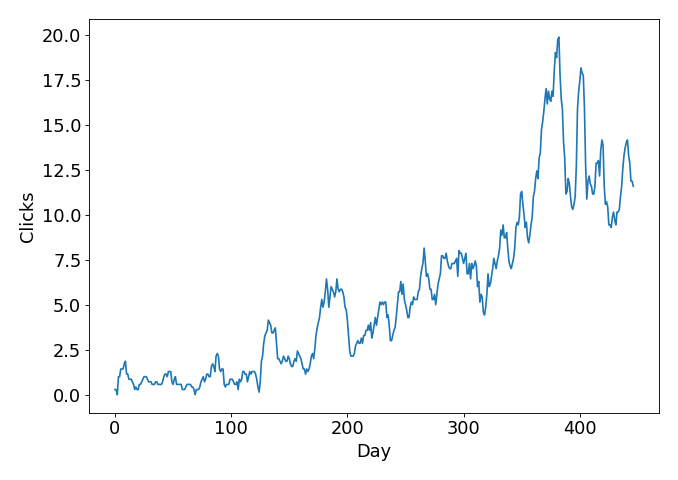
What you see above is not the daily number of clicks, but a 7-day moving average of this quantity. Here is how to calculate a moving average using Python:
import numpy as np

def moving_average(a, n=7) :
    ret = np.cumsum(a, dtype=float)
    ret[n:] = ret[n:] - ret[:-n]
    return ret[n - 1:] / n
From the plot, we can see that some growth is happening over time.
Given this data, how many clicks a day are expected, say, after one year?
Finding a model
To create our model, we load the dataset into TuringBot and start the symbolic regression search. To make the model robust, we use 50/50 cross-validation with the first points in the dataset used for training and the last ones for testing:
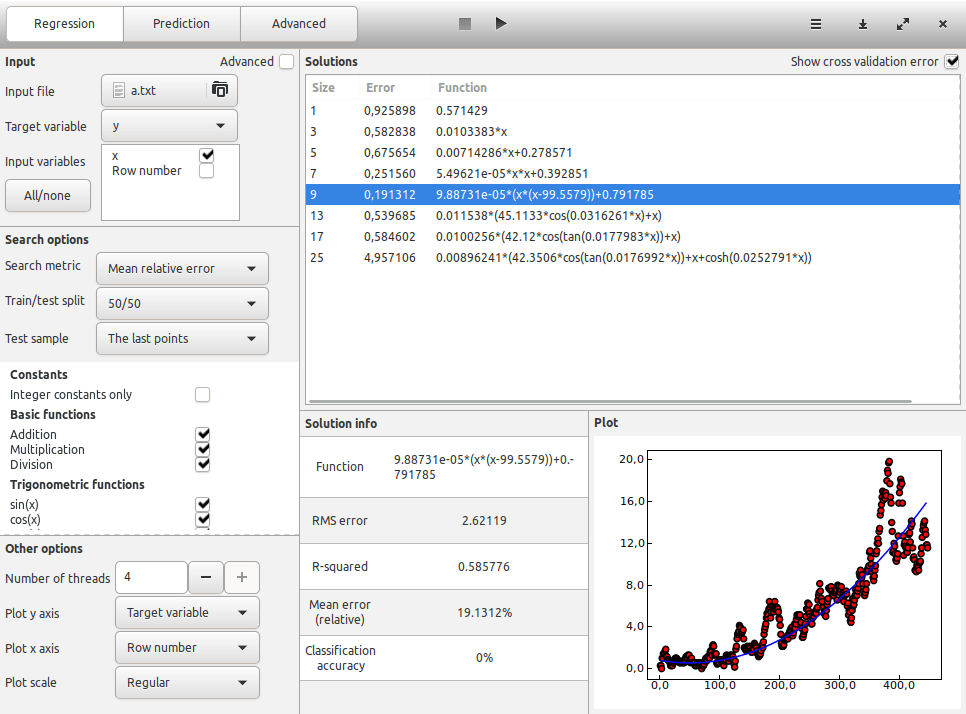
Many formulas are discovered. The one with the smallest out-of-sample error turned out to be nothing fancy in this case. It was a simple quadratic equation:
clicks = 9.88731e-05*(x*(x-99.5579))+0.791785
Making a prediction
With this model at hand, we can just plug in future values of x in it and make predictions for the number of clicks.
In the dataset, the last value of x is 446. So the future begins at x = 447.
If we plot the predictions of the model for the next 365 days, this is what we get:
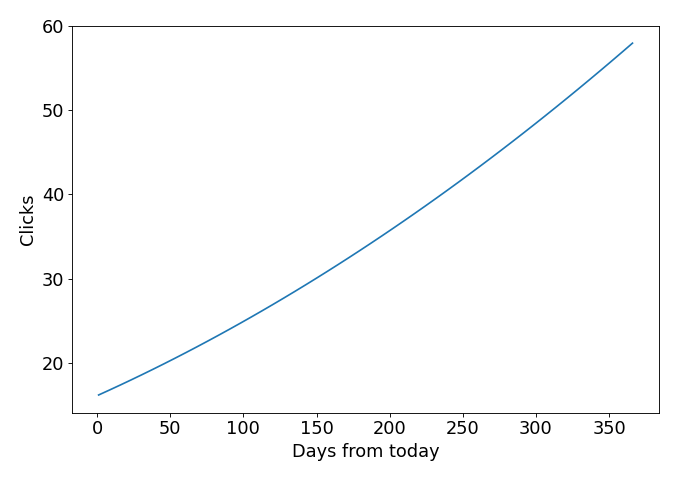
According to this model, that website is expected to grow 259% in the next year.
Final notes
The model that we have described here is extremely simple. It is a cross-validated fit for a time series based solely on the day index.
In a real-world scenario, you would probably have more data to use, allowing more interesting models to be generated.