Predicting whether the price of a stock will rise or fall is perhaps one of the most difficult machine-learning tasks. Signals must be found on datasets that are dominated by noise, and in a robust way that will generalize well past the training data.
In this tutorial, we are going to show how an AI trading system can be created using a technique called Symbolic Regression. The idea will be to try to find a formula that classifies whether the price of a stock will rise or fall the following day based on its price candles (open, high, low, close) in the last 14 days.
- Built S&P 500 next-day direction predictor with 60.5% out-of-sample accuracy
- Formula uses only 14 days of OHLC data—no technical indicators required
- Model is a single equation: deployable in any trading platform without ML libraries
- TuringBot's 50/50 train/test split prevents overfitting on autocorrelated data
AI trading system concept
Our AI trading system will be a classification algorithm: it will take past data as input, and output 0 if the stock is likely to fall in the following day and 1 if it is likely to rise. The first step in generating this model is to prepare a training dataset in which each row contains all the relevant past data and a 0 or 1 label based on what happened the following day.
We can be very creative about what past data to use as input while generating the model. For instance, we could include technical indicators such as RSI and MACD, sentiment data, etc. But for the sake of this example, all we are going to use are the OHLC prices of the last 14 candles.
Our training dataset should then contain the following columns:
open_1,high_1,low_1,close_1,...,open_14,high_14,low_14,close_14,label
Here index 1 denotes the last trading day, index 2 the trading day before that, etc.
Symbolic Regression vs. Neural Networks for Trading
Before diving into the implementation, here's why symbolic regression is particularly well-suited for trading signals:
| Aspect | TuringBot Formula | LSTM / Neural Network |
|---|---|---|
| Model output | Readable equation | Black box weights |
| Deployment | Any platform (Excel, MT4, Python) | Requires TensorFlow/PyTorch |
| Overfitting detection | Visual train/test comparison | Validation curves |
| Interpretability | See which candles matter | SHAP analysis required |
Generating the training dataset
To make things interesting, we are going to train our model on data for the S&P 500 index over the last year, as retrieved from Yahoo Finance. The raw dataset can be found here: SPX.csv.
To process this CSV file into the format that we need for the training, we have created the following Python script which uses the Pandas library:
import pandas as pd

# Read the CSV file into a DataFrame
df = pd.read_csv('SPX.csv')
training_data = []

# Iterate through the DataFrame rows
for i, row in df.iterrows():
    if i < 13 or i + 1 >= len(df):
        continue

    # Extract features for the last 14 days
    features = []
    for j in range(i, i - 14, -1):
        features.append(df.iloc[j]['Open'])
        features.append(df.iloc[j]['High'])
        features.append(df.iloc[j]['Low'])
        features.append(df.iloc[j]['Close'])

    # Add the label: 1 if the next day's close is higher, otherwise 0
    label = 1 if df.iloc[i + 1]['Close'] > row['Close'] else 0
    features.append(label)

    training_data.append(features)

# Create column names for the DataFrame
columns = []
for i in range(1, 15):
    columns.extend([f'open_{i}', f'high_{i}', f'low_{i}', f'close_{i}'])
columns.append('label')

# Convert the training data into a DataFrame and save it to a CSV file
training_data_df = pd.DataFrame(training_data, columns=columns)
training_data_df.to_csv('training.csv', index=False)
All this script does is iterate through the rows in the Yahoo Finance data and generate rows with the OHLC prices of the last 14 candles, and an additional ‘label’ column based on what happened the following day. The result can be found here: training.csv.
Creating a model with symbolic regression
Now that we have the training dataset, we are going to try to find formulas that predict what will happen to the S&P 500 the following day. For that, we are going to use the desktop symbolic regression software TuringBot. This is what the interface of the program looks like:
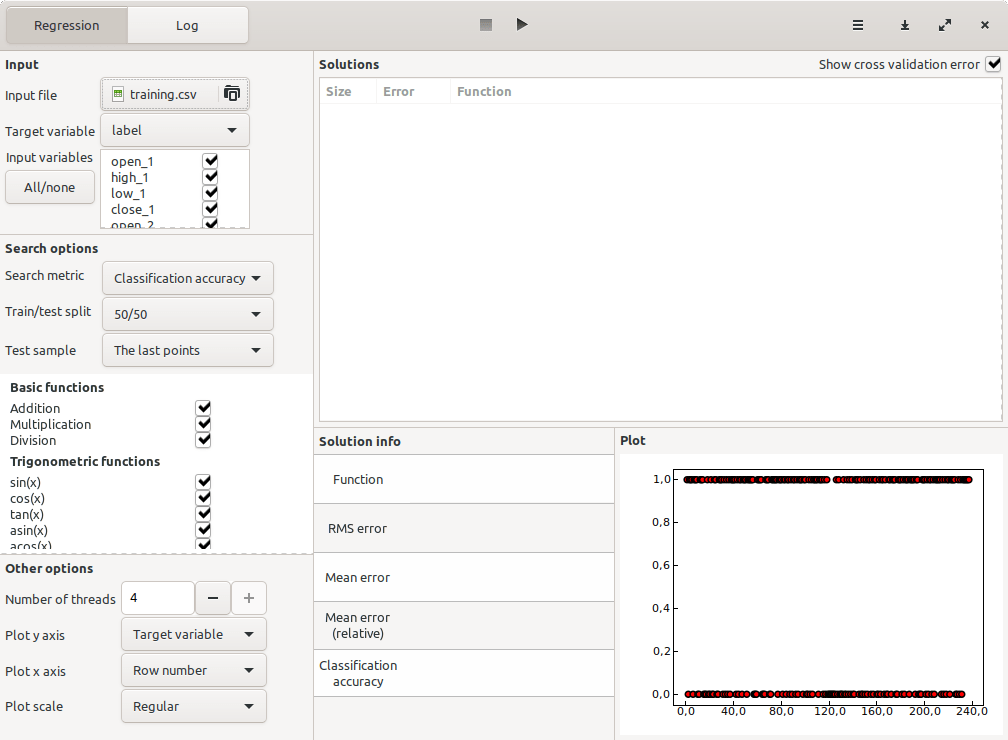
The input file is selected from the menu on the upper left. We also select the following settings:
- Search metric: Classification accuracy.
- Test/train split: 50/50. This will allow us to easily discard overfit models.
- Test sample: The last points. The other option is “chosen randomly”, which would make it easier to overfit the data due to autocorrelation.
With these settings in place, we can start the search by clicking on the play button at the top of the interface. The best solutions found so far will be shown in real time, ordered by complexity, and their out-of-sample errors can be seen by toggling the “show cross-validation” button on the upper right.
After letting the optimization run for a few minutes, these were the models that were encountered:
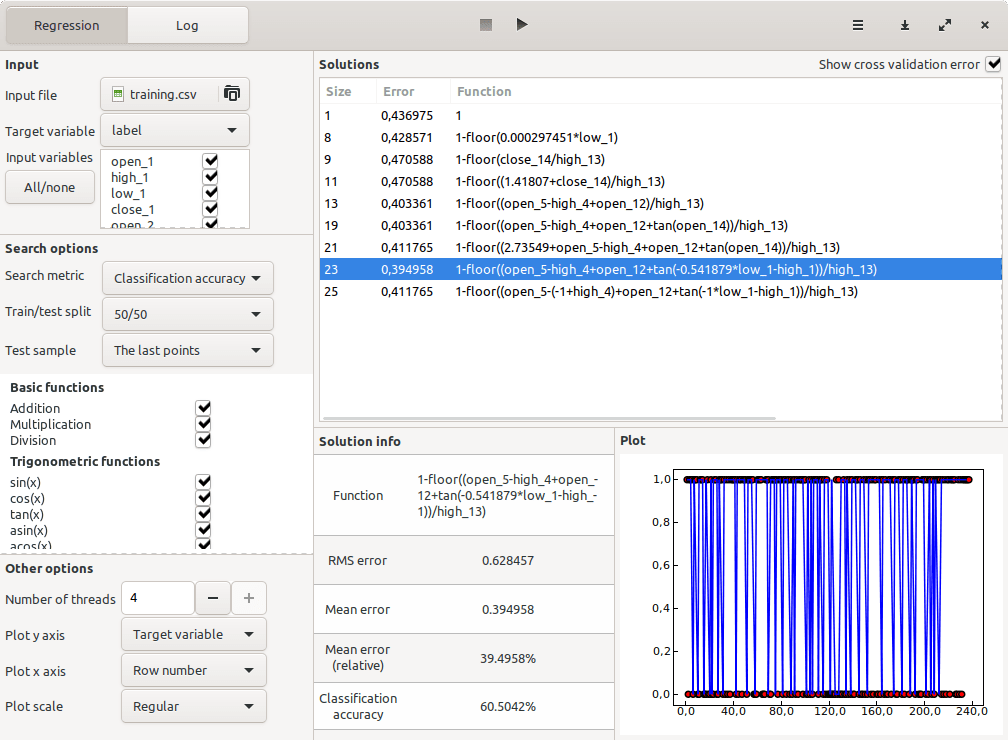
The one with the best out-of-sample accuracy turned out to be the one with size 23. Its win rate in the test domain was 60.5%. This is the model:
label = 1 - floor((open_5 - high_4 + open_12 + tan(-0.541879 * low_1 - high_1)) / high_13)The formula reveals which price levels drive the prediction: day 1 high/low, day 4 high, day 5 open, day 12 open, and day 13 high. This interpretability is a key advantage over black-box neural networks—you can see exactly what the model is looking at.
Why Formulas Beat Black-Box Trading Models
- Audit trail: Know exactly why a trade was triggered
- No library lock-in: Deploy in Excel, Pine Script, MT4, or any language
- Fast execution: Single equation computes in microseconds
- Feature insight: Formula shows which historical candles matter most
Conclusion
In this tutorial, we have generated an AI trading signal using symbolic regression. This model achieved 60.5% out-of-sample accuracy in predicting what the S&P 500 would do the next day, using nothing but the OHLC prices of the last 14 trading days.
Even better models could probably be obtained if more interesting past data was used for the training, such as technical indicators (RSI, MACD, etc) or sentiment data. The key advantage of this approach is that the resulting formula can be deployed anywhere—no machine learning libraries required.
The model was created with the TuringBot symbolic regression software, which has versions for Windows, macOS, and Linux. Download it for free to build your own trading signals.