- Predicted house prices with 8% mean relative error using only 3 variables
- Formula:
price = fire_place + 15.5668 + (1.66153 + bathrooms) * local_price - Symbolic regression automatically identified relevant features (bathrooms, fireplaces, local price)
- TuringBot runs directly on Windows/Mac/Linux—just download and open
Why Symbolic Regression for Price Prediction?
| Aspect | TuringBot | Random Forest / XGBoost |
|---|---|---|
| Output | Explicit formula | Feature importance scores |
| Feature selection | Automatic (in formula) | Manual threshold decisions |
| Deployment | Single equation (Excel/SQL) | Requires sklearn/xgboost |
| Stakeholder buy-in | Show the formula | "Trust the model" |
Dataset: House Prices
Dataset: house_prices.txt (source: FSU regression datasets)
Columns:
Index;
Local selling prices, in hundreds of dollars;
Number of bathrooms;
Area of the site in thousands of square feet;
Size of the living space in thousands of square feet;
Number of garages;
Number of rooms;
Number of bedrooms;
Age in years;
Construction type (1=brick, 2=brick/wood, 3=aluminum/wood, 4=wood);
Number of fireplaces;
Selling price.
The goal is to predict the last column, the selling price, as a function of all the other variables. To do that, we are going to use a technique called symbolic regression, which attempts to find explicit mathematical formulas that connect the input variables to the target variable.
We will use the desktop software TuringBot, which can be downloaded for free, to find that regression model. The usage is quite straightforward: you load the input file through the interface, select which variable is the target and which variables should be used as input, and then start the search. This is what its interface looks like with the data loaded in:
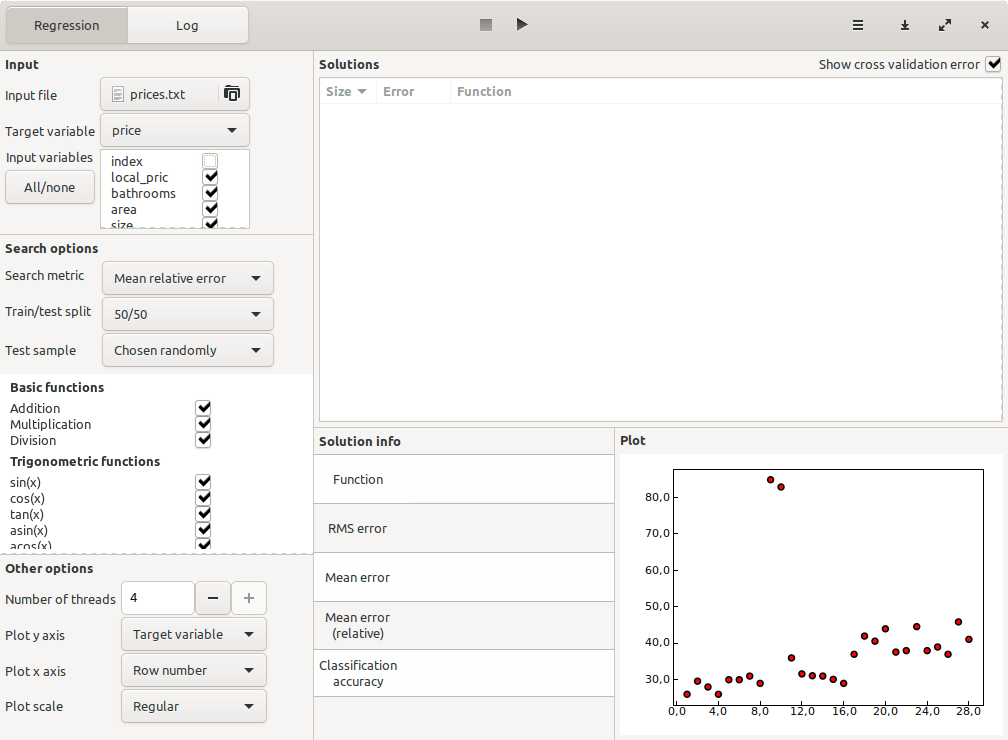
We have also enabled the cross-validation feature with a 50/50 test/train split (see the “Search options” menu in the image above). This will allow us to easily discard overfit formulas.
After running the optimization for a few minutes, the formulas found by the program and their corresponding out-of-sample errors were the following:
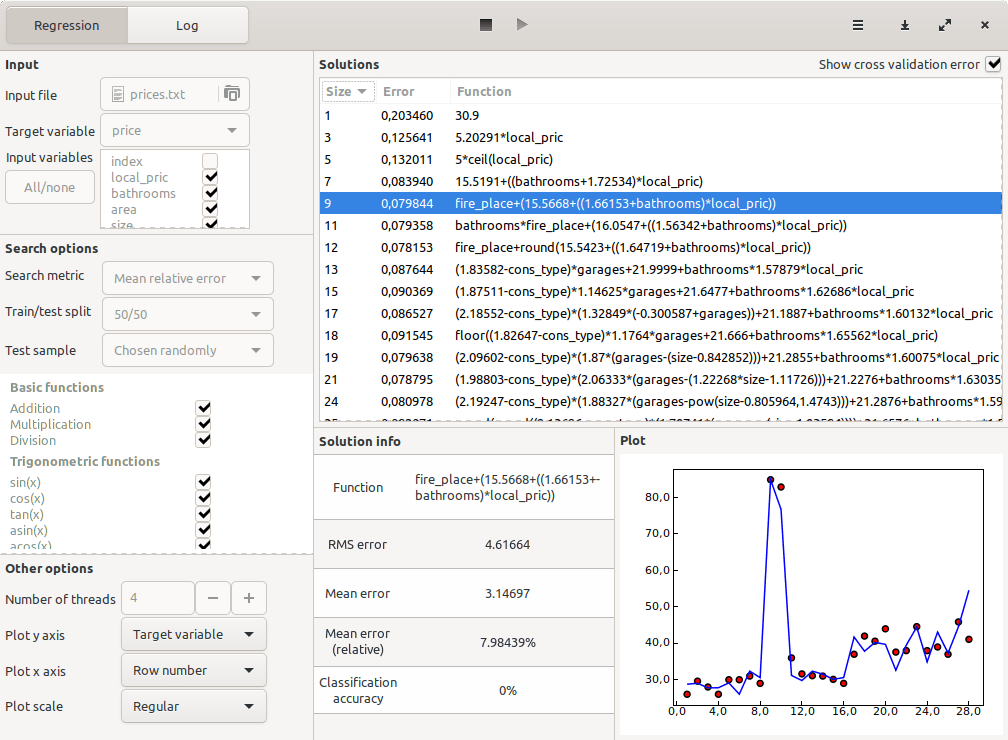
The highlighted one turned out to be the best — more complex solutions did not offer increased out-of-sample accuracy. Its mean relative error in the test dataset was roughly 8%. Here is that formula:
price = fire_place + 15.5668 + (1.66153 + bathrooms) * local_pric
Key Insight: Automatic Feature Selection
The formula uses only 3 of 10 available features: bathrooms, fireplaces, and local price. TuringBot automatically discovered that other features (bedrooms, age, construction type, etc.) don't improve prediction accuracy—information that would require manual feature importance analysis with traditional ML.
Deploy Anywhere
The discovered formula can be implemented in:
- Excel:
=fire_place + 15.5668 + (1.66153 + bathrooms) * local_price - SQL: Direct use in database queries
- Any programming language without ML libraries
Download TuringBot to find interpretable formulas in your own datasets.